Data Wrangling In Python
In this project I explored the different ways one can get data and the various data sources available.While exploring the data,I also showed how you can merge dataframes from different sources
A data analyst experienced in Python,SQL,PowerBI and Tableau.I am also very versed in data storytelling and visualisations of data. @joyakis .
In this project I explored the different ways one can get data and the various data sources available.While exploring the data,I also showed how you can merge dataframes from different sources
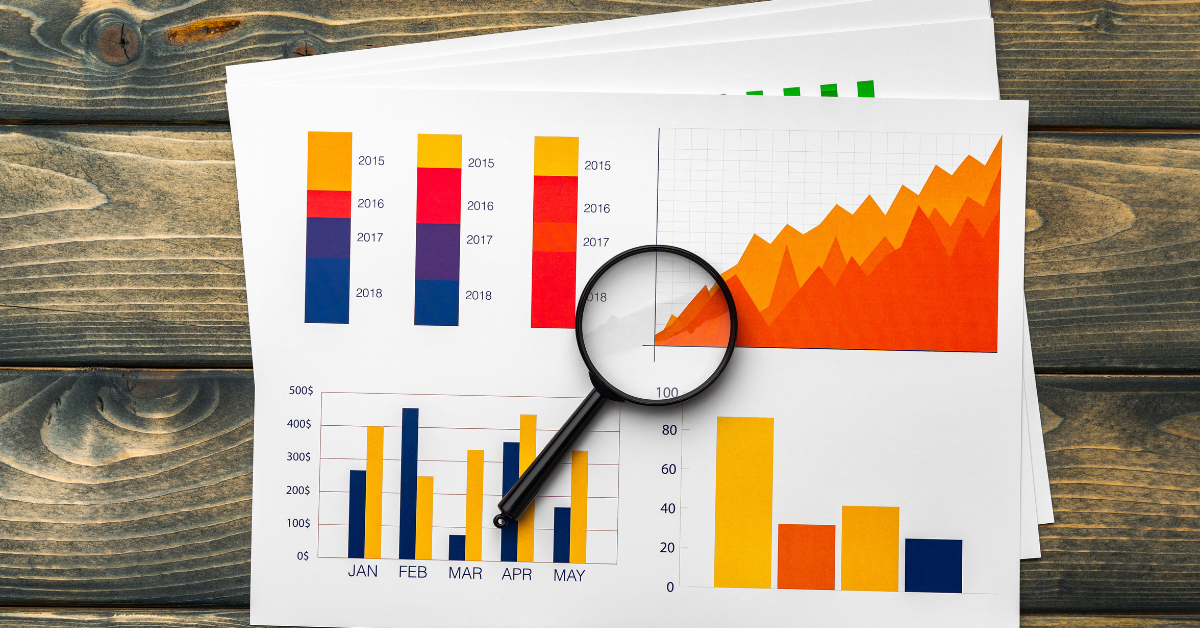
In this project,I explored a dataset for certain trends in the data that could be useful in drawing insights .
For Data Visualisation,I used various python libraries such as matplotlib for effective visualisation of data.I also categorised them in terms of either univariate,multivariate or bivariate analysis .
Bokeh is a Python library that allows you to create interactive data visualizations that are optimized for web browsers, making it a popular choice for data analysts.Bokeh creates visualizations that are optimized for web browsers using JavaScript, HTML, and CSS.In this project i drew plots based on the data given and was able to make informed decisions

SQL here in this project aims to get backend data that is stored in a database system using the various SQL syntaxes
In this Project I used Tableau as a dashboard for visualising data and cmmunicate data findings to a non technical audience
In this project I used Tableau to transform and clean the data then created interactive visualizations, reports, and dashboards
Nairobi,Kenya